Your glucose tells a story. We help you rewrite it.
Glucopath pairs your continuous glucose data with behavioral nudges to flatten spikes before they compound — a pocket endocrinologist for Type 1, Type 2, and pre-diabetics.
Jump to
Three steps from reading to rewrite
Glucopath works in the background of your day — connecting, learning, and intervening at the exact moment it matters.
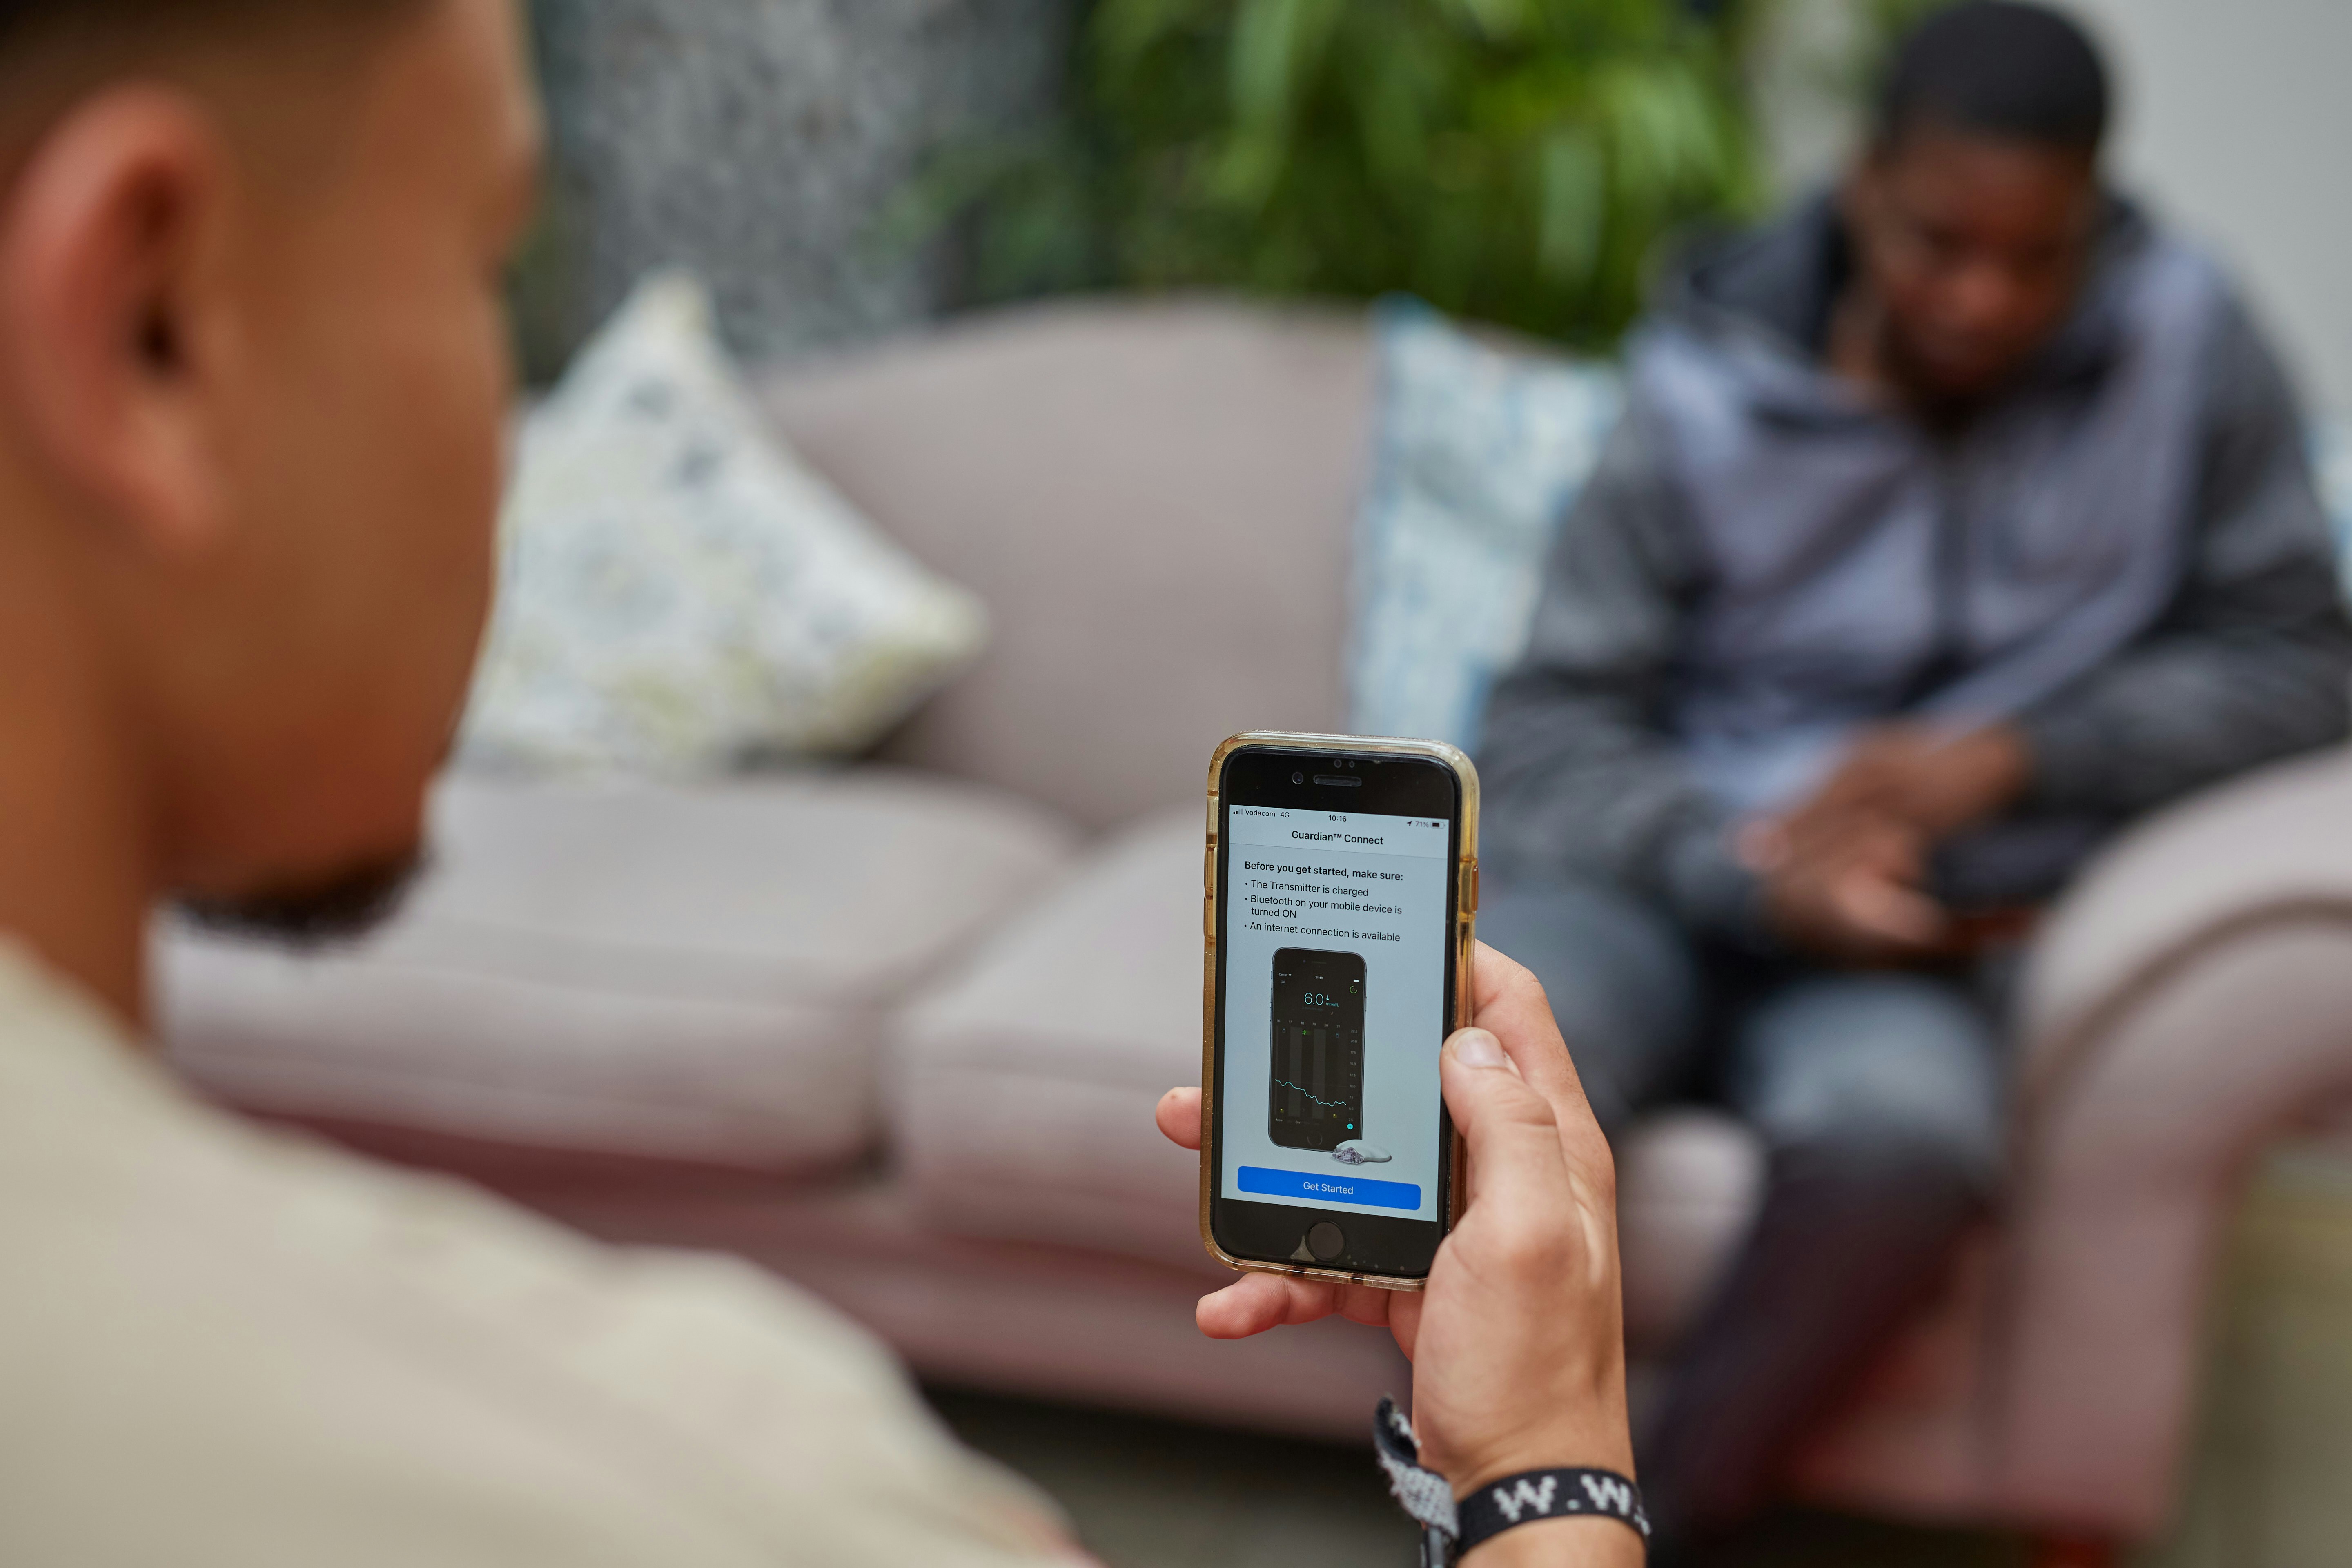
Connect Device
Sync your CGM or log manually
Glucopath integrates with Dexcom G7, Libre 3, and Omnipod. No CGM? Log readings manually in under ten seconds. Your data, your pace.
7-Day Pattern
Glucopath reads your patterns
Our engine processes your time-in-range, post-meal spikes, overnight variability, and carb-response curves — building a behavioral map unique to your physiology.
Pre-meal nudge
A 10-min walk before dinner reduces your post-meal spike by ~18 mg/dL based on your Tuesday pattern.
Receive your behavioral nudge
At the right moment — before a meal, after a walk, during a stress window — Glucopath delivers a precise, evidence-based intervention. Not an alarm. A nudge.
Built on four clinical frameworks
Glucopath's intervention engine is not proprietary magic. It is a direct implementation of published clinical evidence — each framework below links to the peer-reviewed study it is derived from.
“The goal is not to give you more data. The goal is to give you the one insight that changes what you do in the next ten minutes.”
— Glucopath Clinical Advisory Board
0.9%
Avg A1C reduction at 12 weeks
84%
Members reach TIR target
23
Published studies inform the engine
Time in Range
The percentage of time glucose stays between 70–180 mg/dL. Every 5% improvement correlates with meaningful reduction in microvascular risk.
Bergenstal et al., Diabetes Care 2019Glycemic Variability
Coefficient of variation below 36% is the clinical target. High GV predicts oxidative stress independent of mean glucose.
Hirsch & Brownlee, J Clin Invest 2005Post-Prandial Glucose Excursion
Spike amplitude and duration after meals. Behavioral interventions — timing, sequence, movement — reduce PPGE by 15–40% without medication changes.
Jakubowicz et al., Diabetologia 2015CGM + Behavioral Intervention
Combining continuous monitoring with personalized nudges produces 0.8–1.2% A1C reduction over 12 weeks — comparable to adding a second oral agent.
Polonsky & Fisher, JAMA 2022A dashboard that tells you something useful
Nothing blurred, nothing faked. These are the actual metrics in your Glucopath dashboard — labeled with clinical names because you deserve to know what they mean.
Carb-Response Patterns
Your avg spike (mg/dL) per food — calibrated to your CGM data.
Today's nudge
Swap white rice for oatmeal at dinner — saves you ~27 mg/dL of spike based on your Tuesday pattern.
Numbers beside names, not averages beside icons
These are real members, their actual A1C readings before and after, and the diagnosis context that shaped their journey. Dates and diagnosis types included.
A1C Before
8.4%
A1C After
6.9%
"I had been staring at the same A1C for two years. Glucopath showed me it was the Tuesday pasta, not the Wednesday bread. Specific. Actionable. Finally."

Marcus Webb
Austin, TX
Type 2, diagnosed March 2023
A1C Before
7.8%
A1C After
6.7%
"After 13 years I thought I knew everything. Glucopath found an overnight pattern I had been attributing to stress. It was the late workout. Three weeks in I stopped waking at 2 AM."

Priya Krishnamurthy
Seattle, WA
Type 1, managing since 2011
A1C Before
6.2%
A1C After
5.6%
"My doctor circled a number and said “watch this.” I had no idea what to watch. Glucopath turned that circle into a map."

David Okonkwo
Charlotte, NC
Pre-diabetes, flagged Oct 2024
12,400+
Active members
0.9%
Avg A1C reduction
78%
Reach TIR target in 8 weeks
4.8★
App Store rating (2,100 reviews)
Five questions. A result shaped by your answers.
Not a generic demo. A personalized therapy preview built from your diabetes type, management tools, biggest frustration, and A1C baseline.
2 minutes · Free · No credit card